1.2K+
Active Users
Track expenses, analyze spending patterns, and achieve your financial goals with our intuitive expense management platform.
Powerful features designed to make expense tracking effortless and insightful
JWT-based authentication with bcrypt password hashing ensures your financial data stays private and secure.
Track expenses in 15+ currencies including USD, EUR, GBP, JPY, INR, and BDT with automatic conversion.
Create personalized categories with custom colors and icons to organize your expenses your way.
Visualize spending patterns with interactive charts, category breakdowns, and monthly trend analysis.
Filter expenses by category, date range, amount, and more with powerful search and sorting options.
Instant synchronization across all your devices with real-time data updates and notifications.
Explore the powerful capabilities that make expense tracking simple, visual, and insightful. Every feature is designed to give you complete control over your finances.
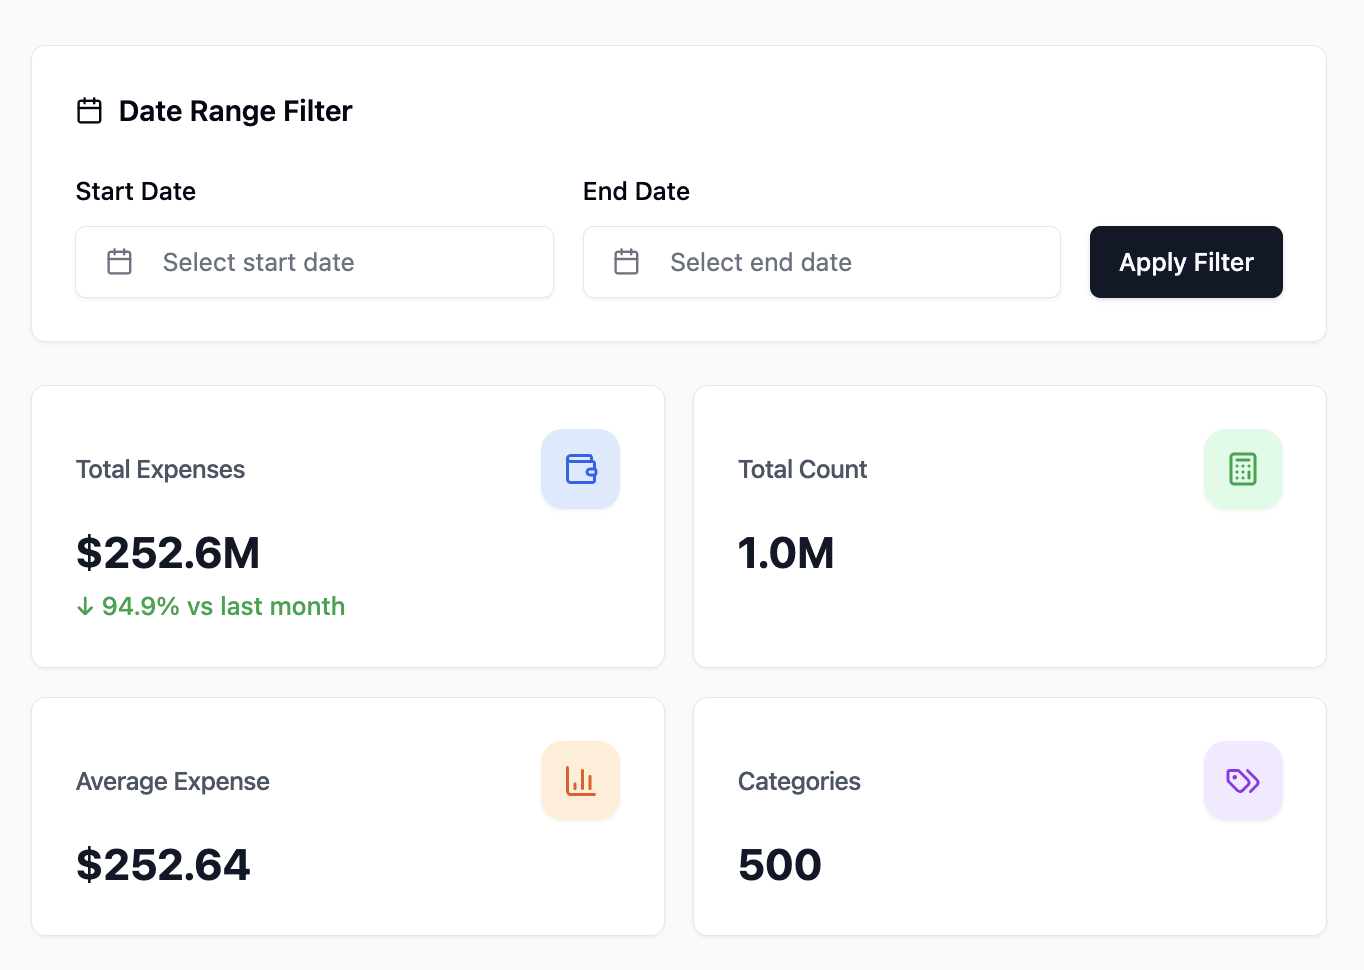
Real-time dashboard with customizable date filters and key performance indicators
Get instant insights with our powerful dashboard. Filter expenses by date range and view key metrics including total expenses, expense count, average spending, and total categories at a glance.
Track your spending patterns month by month with interactive bar charts. Identify seasonal variations, spot unusual spending spikes, and compare current expenses with historical data.
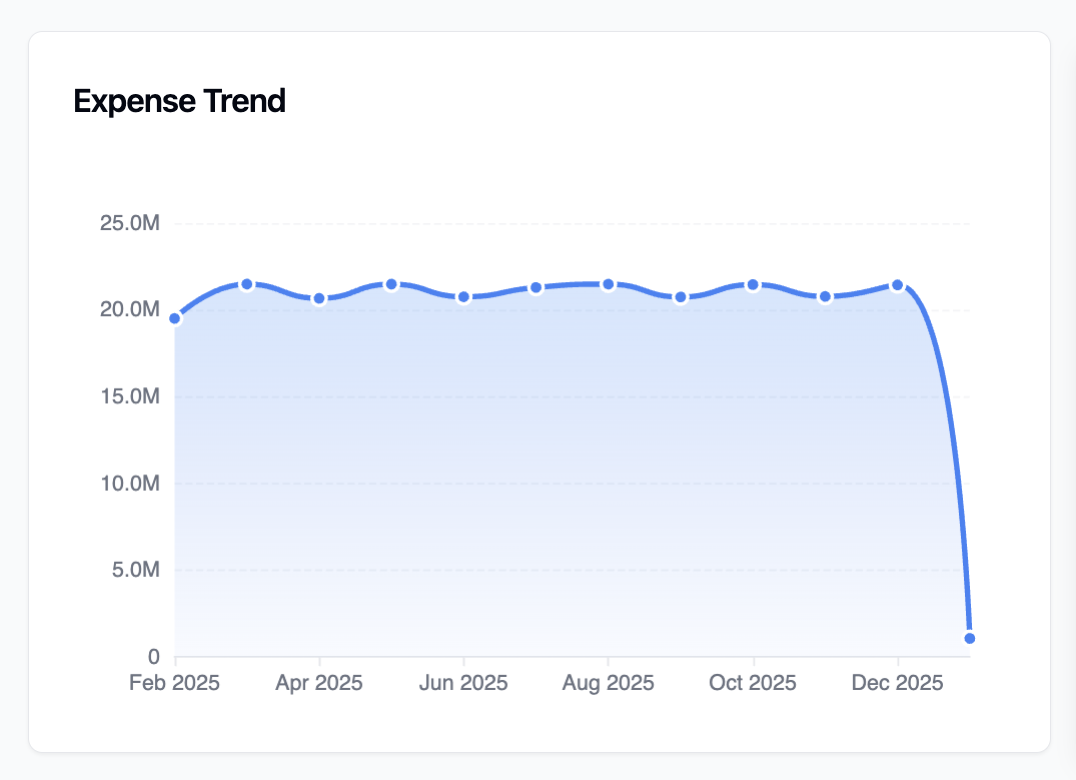
Monthly trends help identify seasonal spending patterns and track year-over-year changes
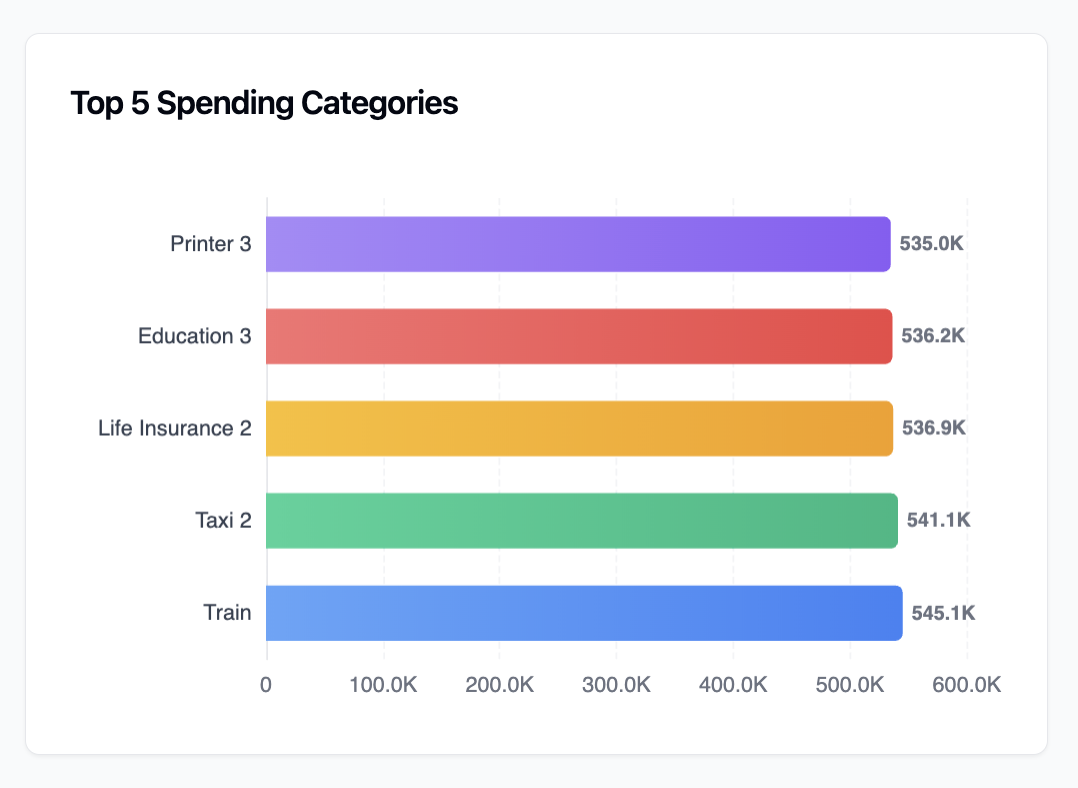
Instantly identify your highest spending categories to make informed budgeting decisions
See at a glance where most of your money goes. Our ranking system automatically identifies and displays your top 5 spending categories with exact amounts and color-coded bars.
Efficiently manage all your expenses in one place. Search, filter by date and category, sort by different criteria, and perform bulk operations on multiple expenses.
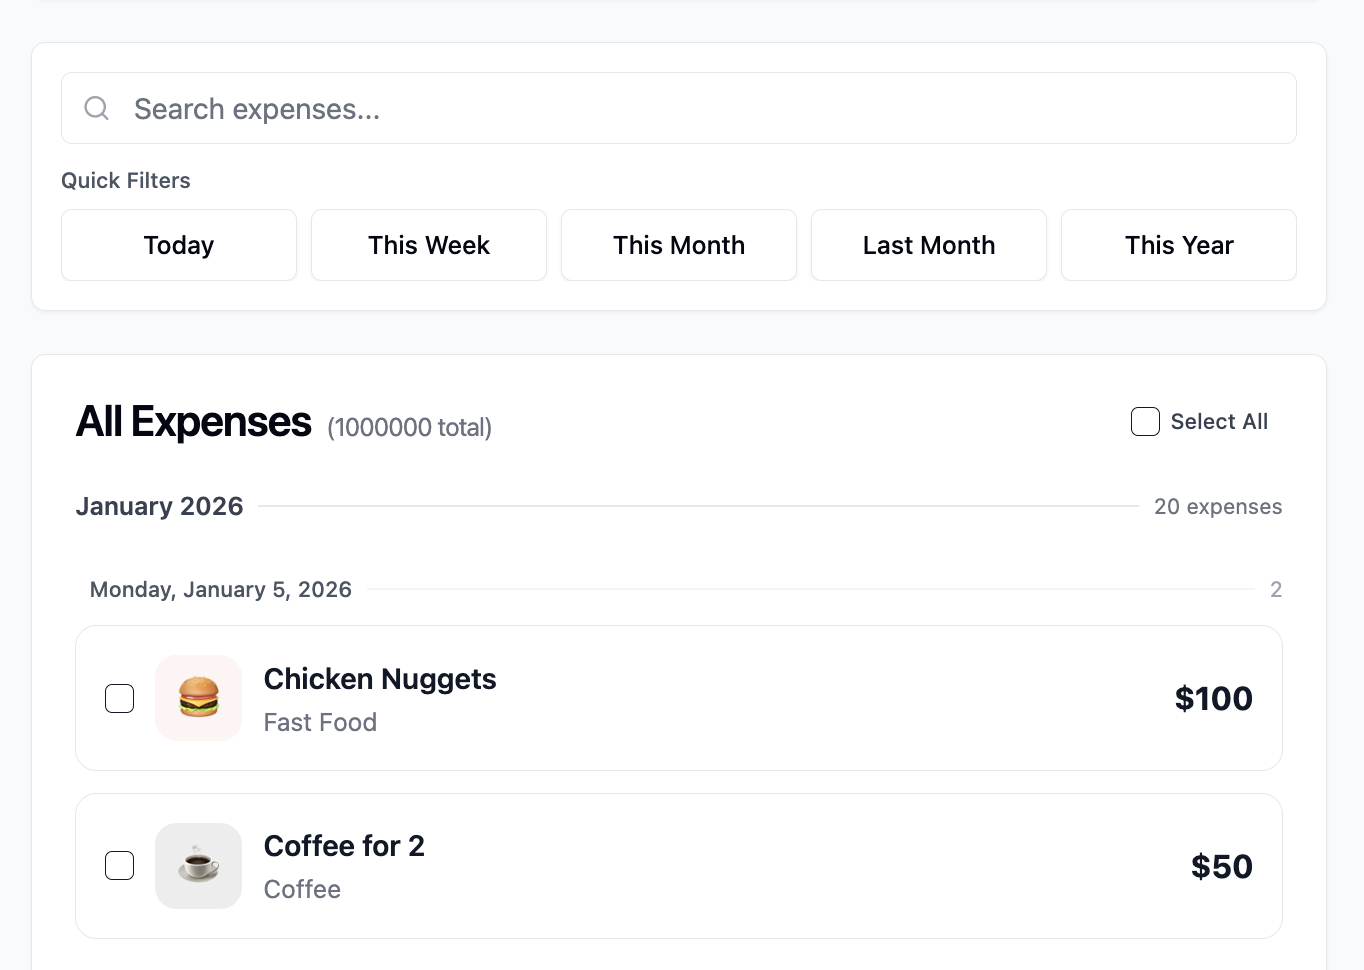
Powerful search and filtering to find any expense in seconds
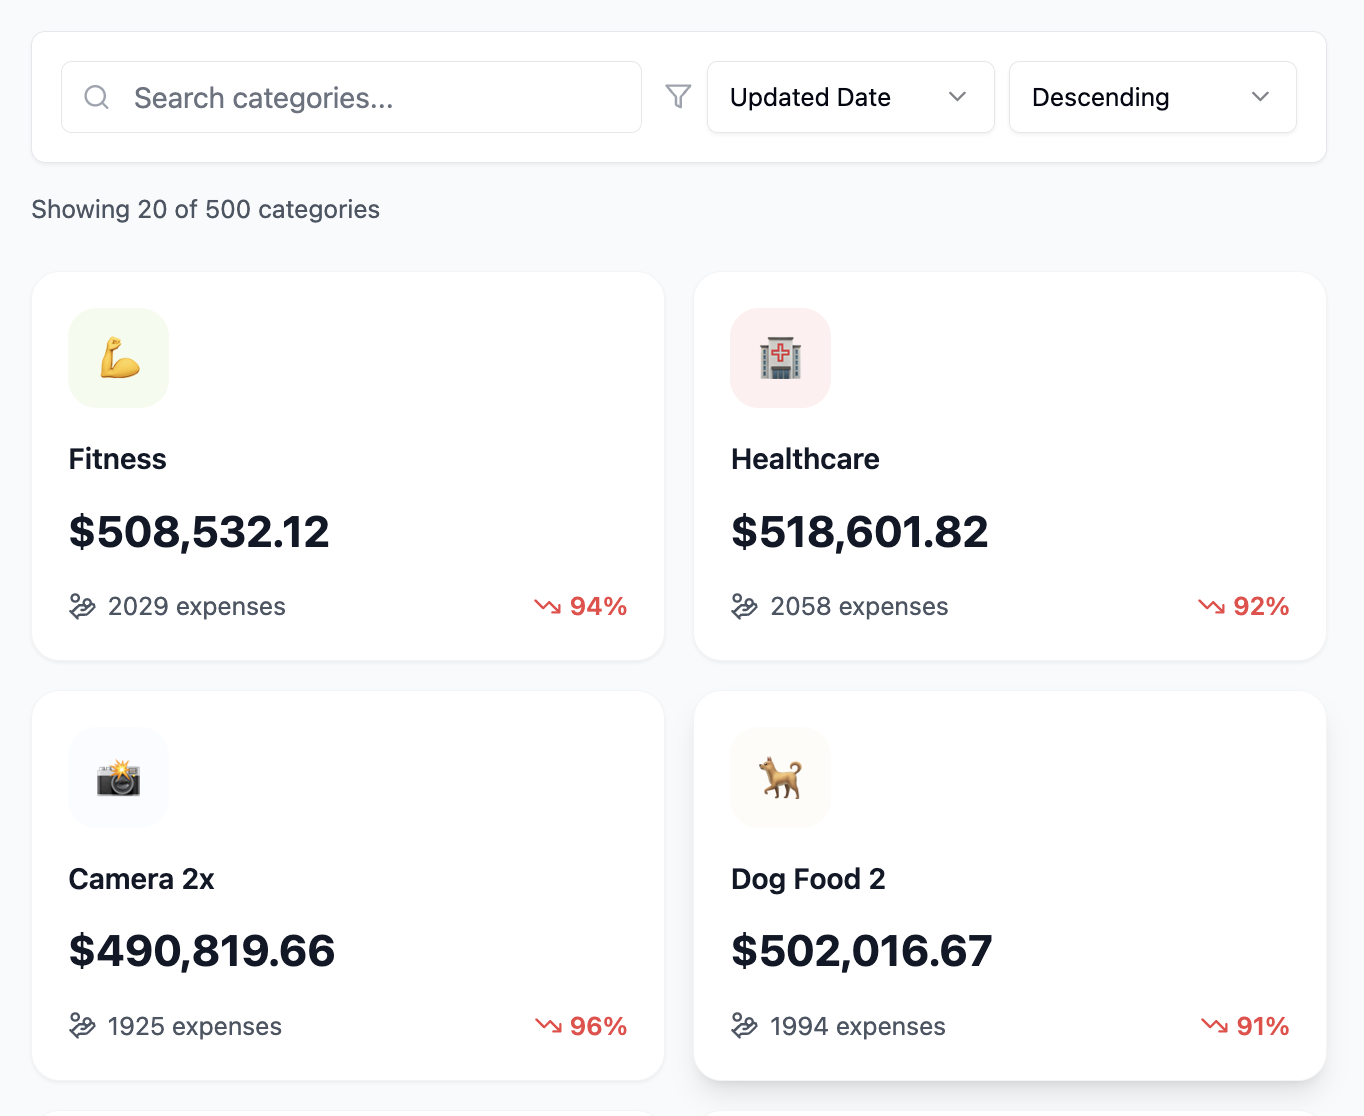
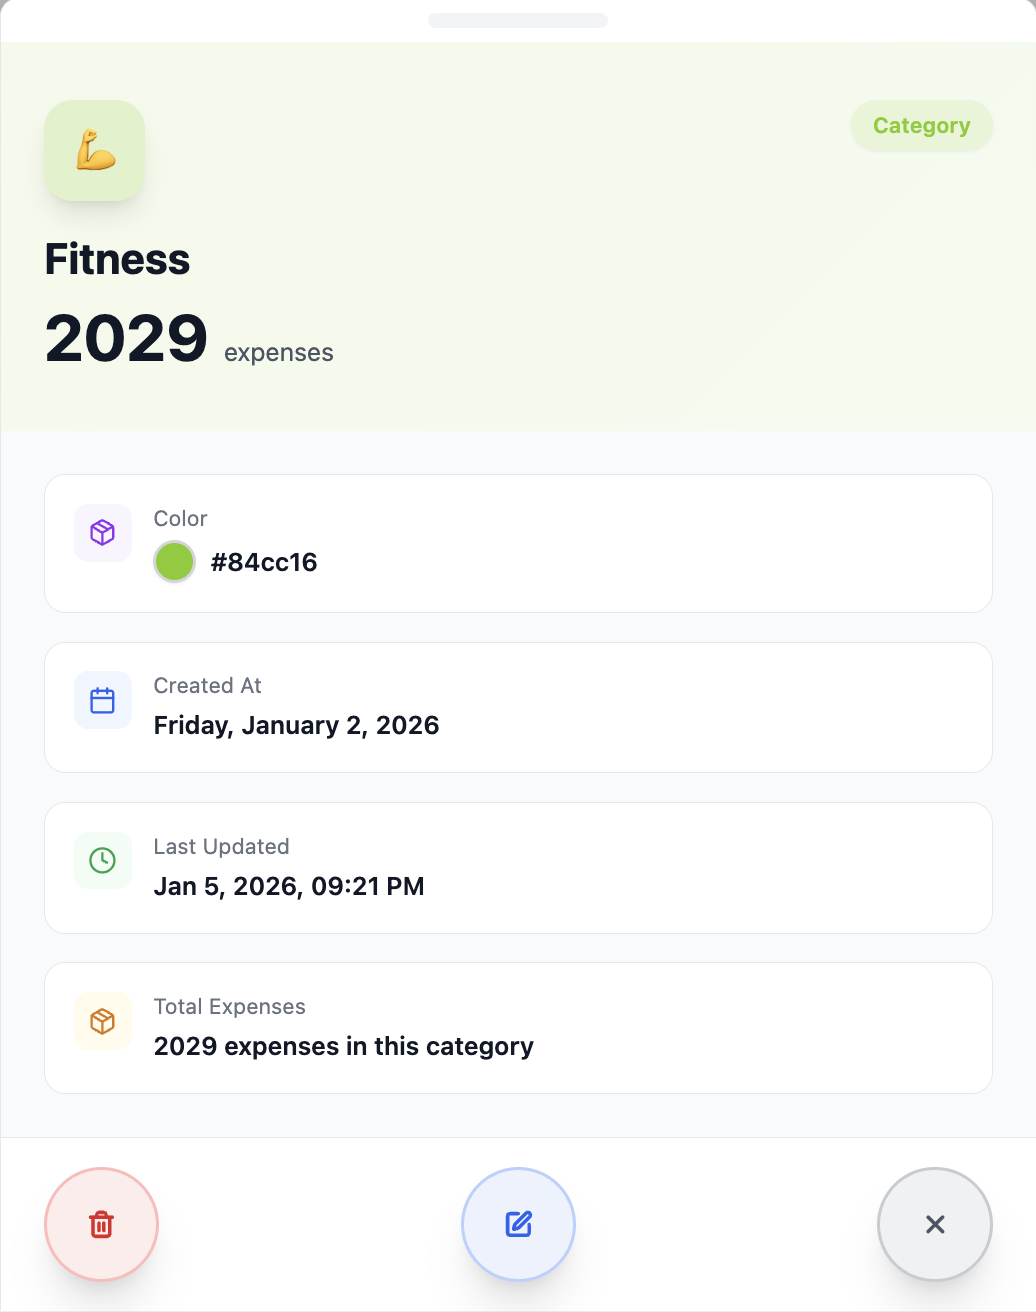
Organize and track spending across customizable categories with real-time statistics
Organize expenses with custom categories. Each category shows total amount, expense count, and percentage change. Search and sort to find categories quickly.
View comprehensive details for any expense. Access all information including dates, amounts, currency, descriptions, and metadata with quick action buttons for editing and deletion.
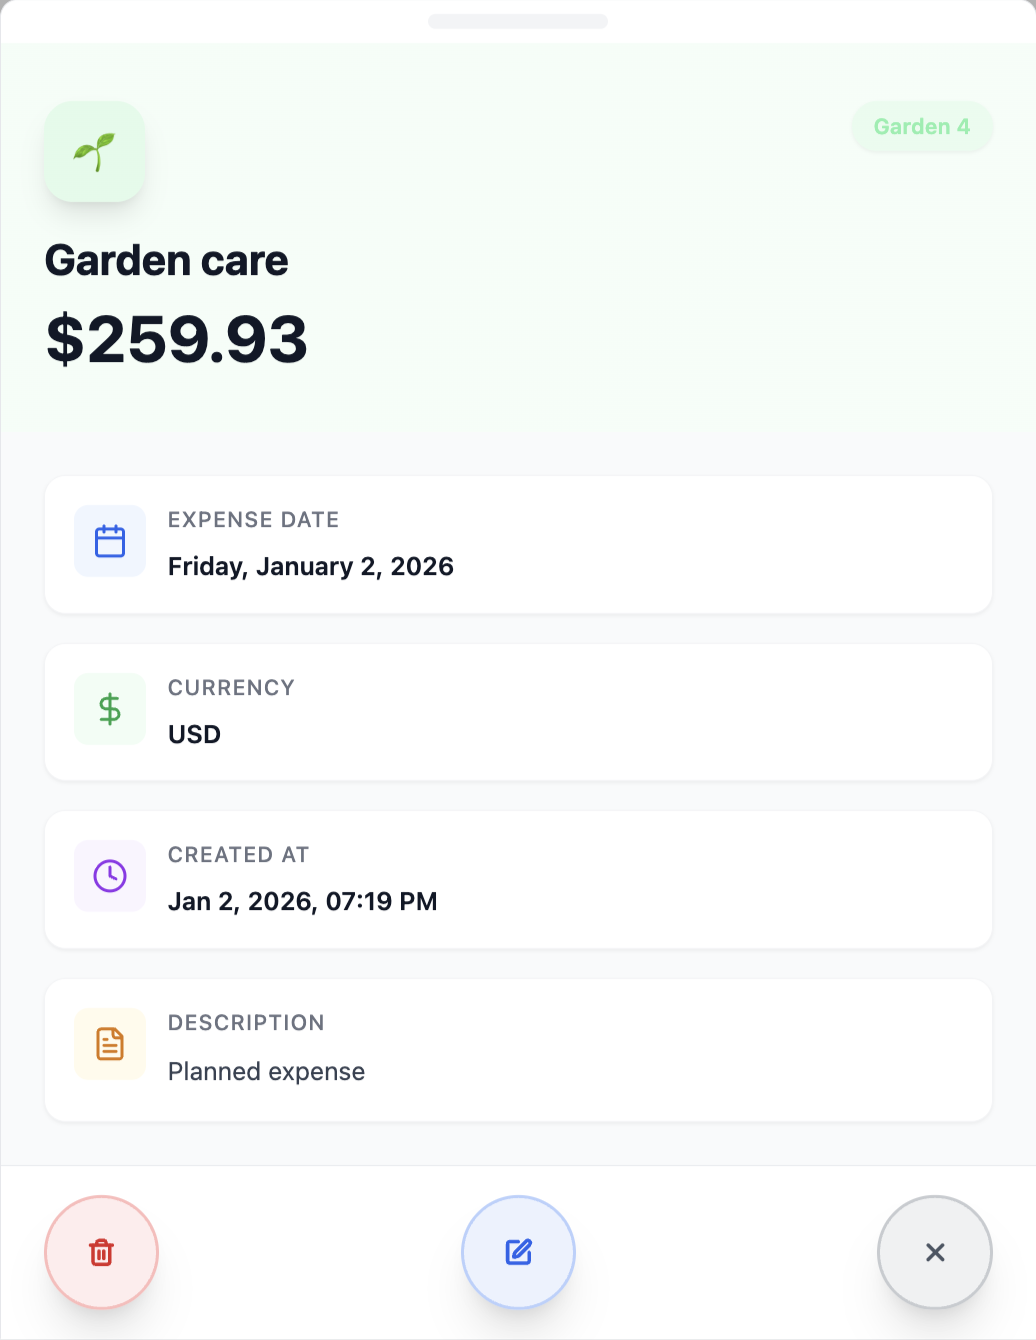
Complete expense details with all metadata and quick actions
Visual breakdown showing percentage distribution across all spending categories
Visualize your category spending distribution with interactive pie charts. See how much you spend in each category with percentage breakdowns and identify areas where you can optimize your budget.
Start tracking your expenses and managing your budget in minutes with our simple three-step process
Sign up with your email and create a secure account in seconds. No credit card required - start tracking expenses immediately.
Start tracking your expenses with custom categories, amounts, and descriptions. Support for 12+ currencies worldwide.
View detailed analytics, identify spending patterns, set budgets, and make smarter financial decisions with real-time insights.
Powered by industry-leading technologies for optimal performance, security, and reliability
Modern UI Framework
Full-stack Framework
REST API Backend
Robust Database
Type-safe Database
Utility-first CSS
Containerization
Secure Authentication
Join over 1,200 users who are already managing their expenses smarter with Expenser - free forever